
Датотека:Bmi30chart.png
Veličina ovog prikaza: 800 × 455 piksela. 4 druge rezolucije: 320 × 182 piksela | 640 × 364 piksela | 1.024 × 582 piksela | 1.600 × 910 piksela.
Originalna datoteka (1.600 × 910 piksela, veličina datoteke: 55 kB, MIME tip: image/png)
| Ovo je datoteka sa Vikimedijine ostave. Informacije sa njene stranice sa opisom prikazane su ispod. Vikimedijina ostava je skladište slobodno licenciralnih multimedijalnih datoteka. I Vi možete da pomognete. |
Opis izmene
| Opis |
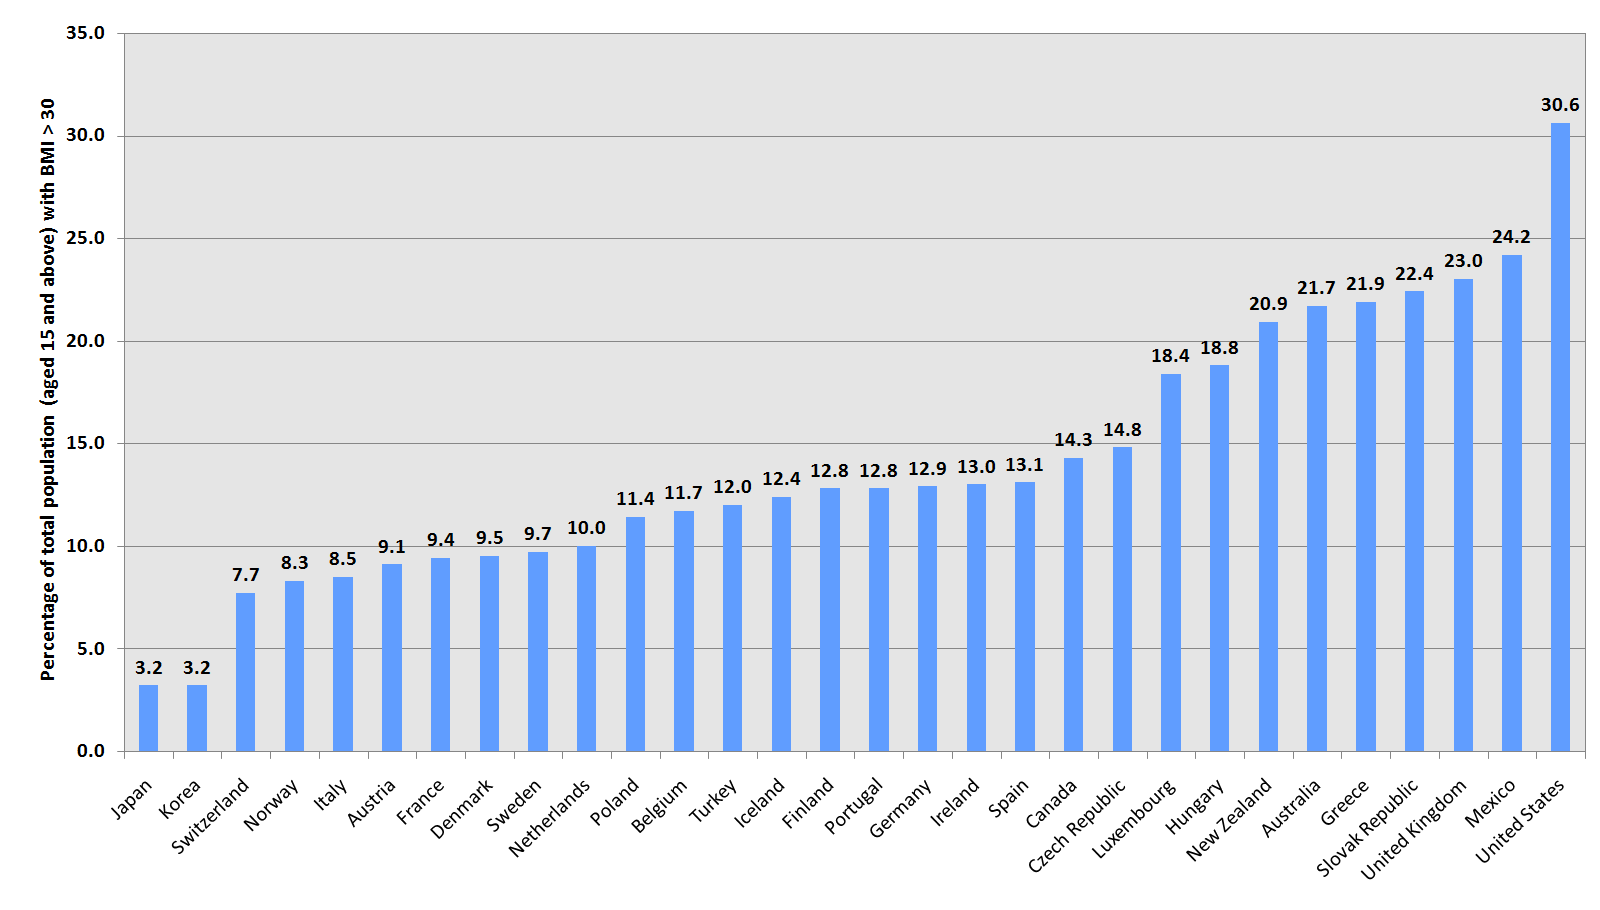
English: This chart compares figures in the population of OECD countries (plus the Czech Republic, Hungary, Poland, Slovakia and Mexico); it shows the percentage of total population (aged 15 and above) with a body mass index greater than 30. The year the figures used for this chart were published, collected or compiled range from 1996 to 2003. Exact years for each country can be found in the documents linked below. |
| Datum | 25. maj 2005. (првобитни датум слања) |
| Izvor |
Graphic chart created by User:Phils using Microsoft Excel 2004 (Mac) and OECD data available for download and discussed here. The actual data was extracted from an Excel data sheet downloadable here, which contains the following source information:
|
| Autor | Phils на English Vikipedija |
| Ostale verzije | An alternate copyrighted graph of the same data, published by OECD can be viewed here. |
Licenciranje
| Ova datoteka je dostupna pod licencom Creative Commons Autorstvo-Deliti pod istim uslovima 3.0 Unported. Подлеже и општем одрицању. | ||
| ||
| Ova licenca je dodata na ovu datoteku kao deo ažuriranja GFDL licence. |

|
Data je dozvola da se kopira, distribuira i/ili menja ovaj dokument pod uslovima GNU-ove licence za slobodnu dokumentaciju, verzije 1.2 ili bilo koje novije verzije koju objavi Zadužbina za slobodni softver; bez nepromenljivih odeljaka i bez teksta na naslovnoj i zadnjoj strani. Tekst licence možete pročitati ovde. Подлеже и општем одрицању. |
Prvobitan dnevnik otpremanja
The original description page was here. All following user names refer to en.wikipedia.
- 2007-03-24 22:42 AtilimGunesBaydin 1600×910× (56622 bytes) Updated with current data from OECD. Added Greece and Turkey existing in the OECD publication and original graph, but missing in the user-created version. Also minor changes in the order of countries.
- 2005-05-25 14:10 Phils 1467×901× (122414 bytes) {{GFDL}} This chart compares obesity figures in the population of OECD countries; it shows the percentage of total population (aged 15 and above) with a body-mass index greater than 30. The year the figures used for this chart were published, collected or
- 2005-05-25 10:46 Phils 0×0× (7028 bytes) {{GFDL}} This chart compares obesity figures in the population of OECD countries; it shows the percentage of total population (aged 15 and above) with a body-mass index greater than 30. The year the figures used for this chart were published, collected or (version lost by MediaWiki)
Istorija datoteke
Kliknite na datum/vreme da biste videli tadašnju verziju datoteke.
| Datum/vreme | Minijatura | Dimenzije | Korisnik | Komentar | |
|---|---|---|---|---|---|
| trenutna | 18:34, 10. septembar 2012. | | 1.600 × 910 (55 kB) | OgreBot | (BOT): Uploading old version of file from en.wikipedia; originally uploaded on 2007-03-24 22:42:19 by AtilimGunesBaydin |
| 19:11, 4. maj 2006. |  | 1.467 × 901 (120 kB) | Deprifry | This chart compares obesity figures in the population of OECD countries; it shows the percentage of total population (aged 15 and above) with a body-mass index greater than 30. The year the figures used for this chart were published, collected or compiled |
Upotreba datoteke
Sledeća stranica koristi ovu datoteku:
Globalna upotreba datoteke
Drugi vikiji koji koriste ovu datoteku:
- Upotreba na ast.wikipedia.org
- Upotreba na de.wikipedia.org
- Upotreba na en.wikipedia.org
- Upotreba na en.wikinews.org
- Upotreba na fi.wikipedia.org
- Upotreba na fr.wikipedia.org
- Upotreba na it.wikipedia.org
- Upotreba na ja.wikipedia.org
- Upotreba na simple.wikipedia.org